Data Visualization
Data Visualization
Data Visualization
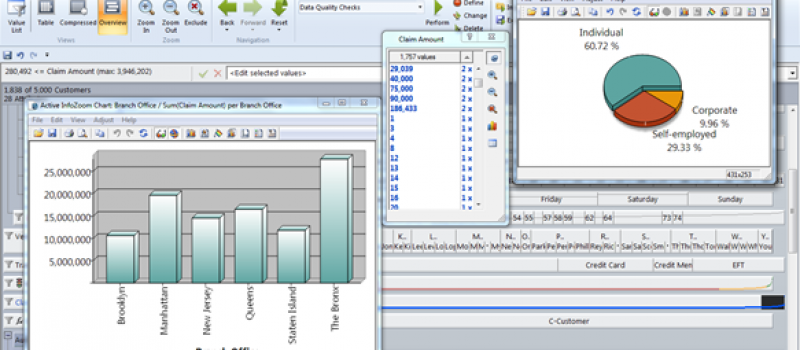
“A picture is worth a thousand words.” This common saying is especially true when looking through large amounts of data, while struggling to identify patterns and trends in that data. That’s where Data Visualization can be very helpful. Seeing answers to your questions before knowing what to ask is a key feature of InfoZoom.
InfoZoom’s unique visualization method allows you to understand the contents of your data at a glance. From this Overview, you can intuitively browse your data and uncover relevant information – all with just a few mouse clicks.
Examine your data directly on the data level. This unique method makes your data – no matter how large or small – understandable at a glance. With just a few clicks, you can set filters for different attributes and make relevant insights immediately visible.


